I see a lot of talented and good developers not using debuggers. Even people who are in the business for multiple years very often just don't do it. Instead of setting up a debugger, they just use var_dump() or console.log() wherever they think their current problem might be.
Admittedly, this does have some advantages: it's done very quickly, and it even works if you don't have an infrastructure for debugging. On the other hand, setting up a debugger can take some time, you need to know how to do it, and it's prone to create very random and not reproducible errors.
The advantages of a having a debugger outweigh the disadvantages of not having one by far.
Setup
For this example, I'm going to use PHPStorm and a local Typo3 installation within a docker container. Depending on your programming language and your IDE, there might be some slight differences, but in the end, every modern debugger should be very similar.
Here are some pros of having a debugger
Stop code whenever you want
Breakpoints
Breakpoints stop the code execution and let you examine what exactly is going on at any particular line in your code. You can set as many Breakpoints you want, and you can even set them on the fly, meaning if you stopped the code and want it to stop again at a later point, you just add the breakpoint while debugging. No need to rerun the program from the beginning.

Conditional Breakpoints
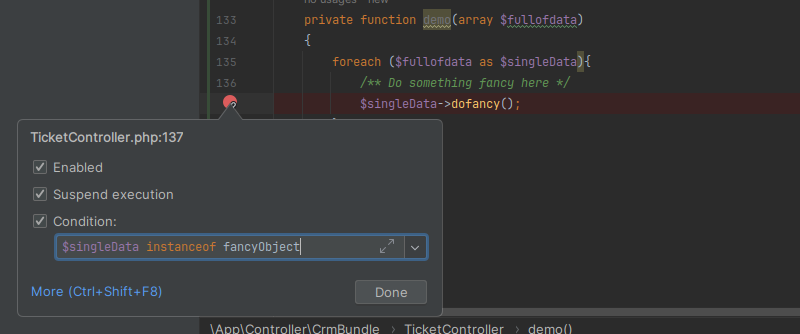
You can even set conditional breakpoints. These special breakpoints stop your code only when a certain condition is met. This is particular usefully when something gets executed twice or more. A good example is iterating over an array, and you only want to see what happens when the array data has a certain value.

The breakpoint in the above example only stops the code execution if $singleData is an instance of fancyObject.
Evaluate functions "on the fly"
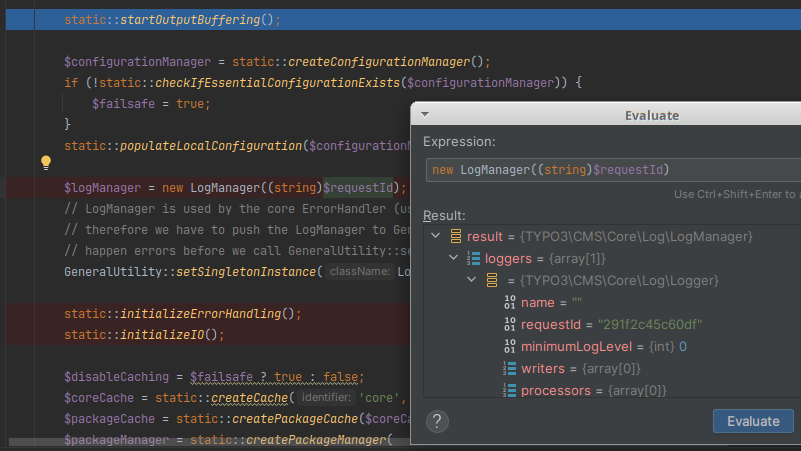
Very often you just want to know what the output of a certain function is, but you don't want to debug the whole function. Of course, you can just stop the code after the function was executed, but that's not always good enough. Let's say the function in question didn't get executed, or it has no return value, what do you do then? You use the Evaluate function of your debugger!

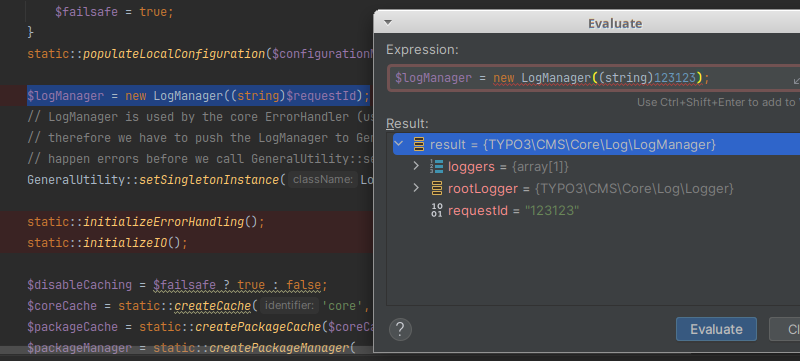
In the above example, you can see a blue line. This is where I added a breakpoint and the code stopped. However, I still want to see what will happen if
$logManager = new LogManager((string)$requestId);
is called. With the Evaluate function of my Debugger, I can already tell without running this particular piece of code. If I wanted to, I could even change $requestId to whatever I need, have a look what at happens and all that without disturbing or breaking the code flow.

After I'm done checking, I'll just click the "next" Button in the debugger and the code continues as if nothing happened.
Show you all variables around your breakpoint
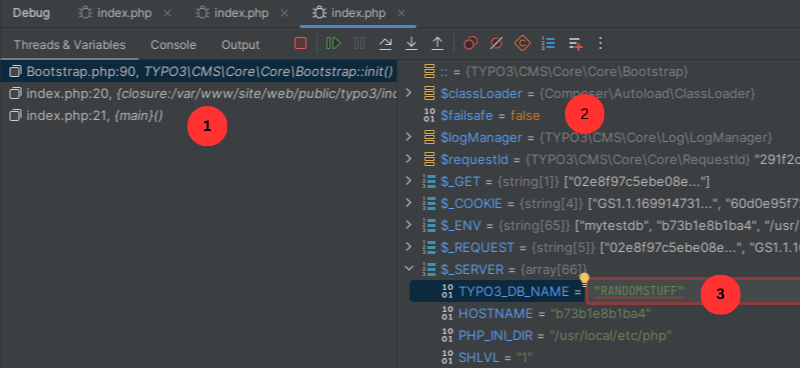
Another cool feature is that you don't only get the variable you're looking for, you get a ton of information around your current breakpoint, and you can even change it to your needs.

Let's break this down together:
- These are the threads and parts of your code that already have been executed. You can see the index.php file, which then did lead to execute the code in Bootstrap.php. There is also the line number. When you click on any entry of that list, it will take you to the correct point in the code.
- At point 2 you can see all the variables that are currently set and used. You even get server and magic variables without having to ask for them extra.
- You can even change the names or the content of the variables, and the newly set values will be used throughout this specific debugging sessions. This is very helpful if you want so see how your code reacts to different values without having to hard code it and rerun it every time.
There is more
I just scratched the surface of what a debugger can do for you. There are so many more use cases that it would be way too much for this article.
Problems a debugger can cause
Not gonna lie: A debugger is not all sunshine. At some point, you might end up debugging the debugger because you forgot to set a path right or something stupid like that. So here are some common problems I regularly run into.
Randomly stopping your program
One minor thing, I sometimes run into, is that I change something in my code, try it out and nothing happens. My first instinct, of course, is always: I broke it! However, 90% of the time an IDE which was running in the background caught the debugging session and stopped the code. Good luck debugging that when nothing actually is wrong with your freshly changed code.
To avoid this (in PHPStorm), give every project a unique name and make sure your IDE doesn't accept random connections - or just run one IDE at the same time.
Randomly not stopping your program
This is another minor thing: Turning off your breakpoints or the debugger and forget to turn them on again. It's possible to deactivate single or even all breakpoints at the same time. Of course, your debugger will do nothing then. It can be very annoying when some data is changed, and you have to reset that again after testing without the debugger running. For example, a database entry you want to debug is changed after executing your program, and you have to reset it before you can start to debug again. However, this you will figure out very quickly.
Make the system slower
This is the only big deal, in my opinion. Depending on how beefy your machine is, a debugger can slow down your system quite a bit. Unfortunately, I really don't know how to fix this besides adding more power to your development system.
Adding extra overhead to your development workflow
And last but not least: Setting up a debugger might take some time and reading to do. There might be issues with path mappings, blocked ports or the thing is just not installed in the environment you're using, and you have to set it up completely from scratch. When you join a new team this happens more often than you would think.